Ask: What are the most populated countries?
Step 1: Go to the ArcGIS Online map, World Population and explore the map.
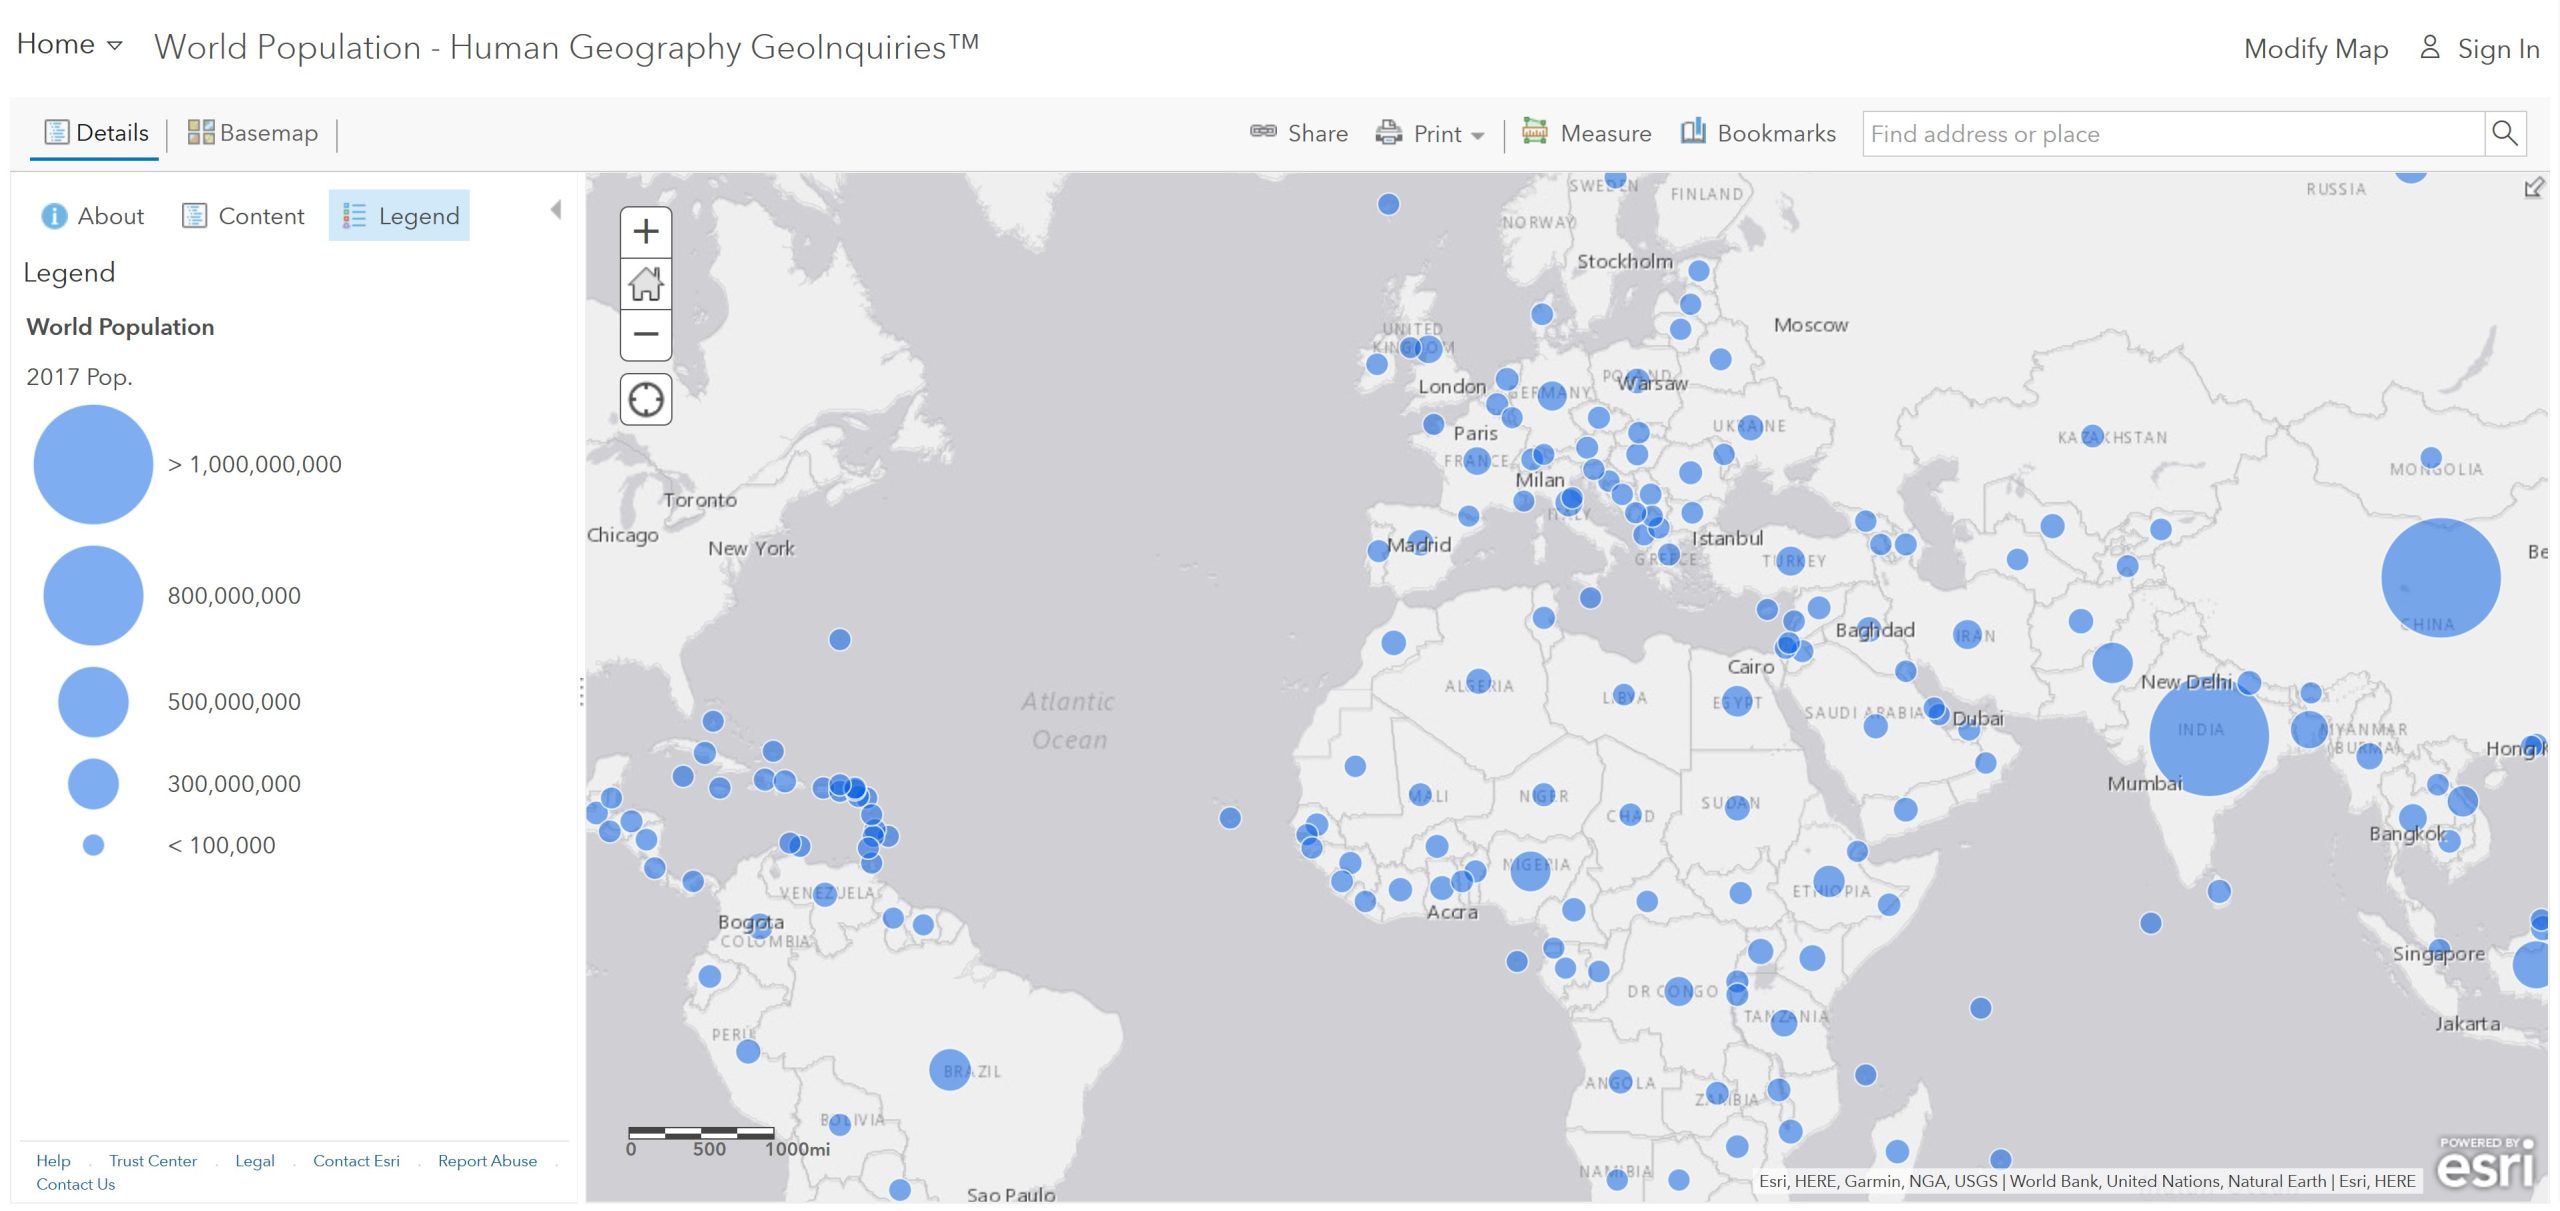
Step 2: With the Details pane visible, click the Content button.
Step 3: To show a legend, click on the layer name, World Population.
- How many people does the largest symbol represent?
Step 4: Click those countries and examine their pop-ups.
- Which two countries have the highest populations?
- Which other three countries have populations over 200 million?
Acquire: Where are the most densely populated countries located?
Step 5: Turn off the layer, World Population.
Step 6: Turn on the layer, Population Density.
Step 7: Hover over the layer name, Population Density. Click the button, Show Table.
Step 8: Sort the Population Density 2017 column in descending order. In the Details pane, click the button, Show Contents of Map. Hover over the layer name. Click the button, Show Table. Click the field name (column header). Finally, choose Sort Ascending or Sort Descending.
- Which two places have the highest densities?
- What factors account for the countries with high population densities?
- What factors account for the countries with low population densities?
Explore: How are total fertility and infant mortality related?
Step 9: Turn on only the layer, Total Fertility Rate (TFR). Close any open table.
- Some patterns observed are that the highest fertility rates are in Africa and the lowest fertility rates are in Eastern and Southern Europe.
Step 10: Examine the pop-ups of at least three countries.
- How have total fertility rates changed over time?
Step 11: Turn off the layer, Total Fertility Rate (TFR).
Step 12: Turn on the layer, Infant Mortality Rate (IMR).
- What is the relationship between infant mortality and total fertility?
Analyze: Which regions are gaining or losing population?
Step 13: Turn on the layer, Natural Increase Rate (NIR).
- Which region has the highest NIR?
- Which country has the highest NIR in 2016, and what is the rate?
- In which regions are populations decreasing?
Step 14: Hover over the layer name, Natural Increase Rate. Click the button, Show Table.
Step 15: Sort the table descending and scroll down. In the Details pane, click the button Show Contents of Map. Hover over the layer name. Click the button, Show Table. Click the field name (column header). Finally, choose Sort Ascending or Sort Descending.
- Which country has the lowest NIR in 2016, and what is the rate?
Step 16: Close any open table.
Step 17: Turn on the layer, Life Expectancy.
- What is the relationship between life expectancy and the Natural Increase Rate?
Act: What can be done to increase or slow population growth?
- What challenges do societies with high or low NIRs face?
- What are some steps that government or non-government agencies can take to slow population growth?
